
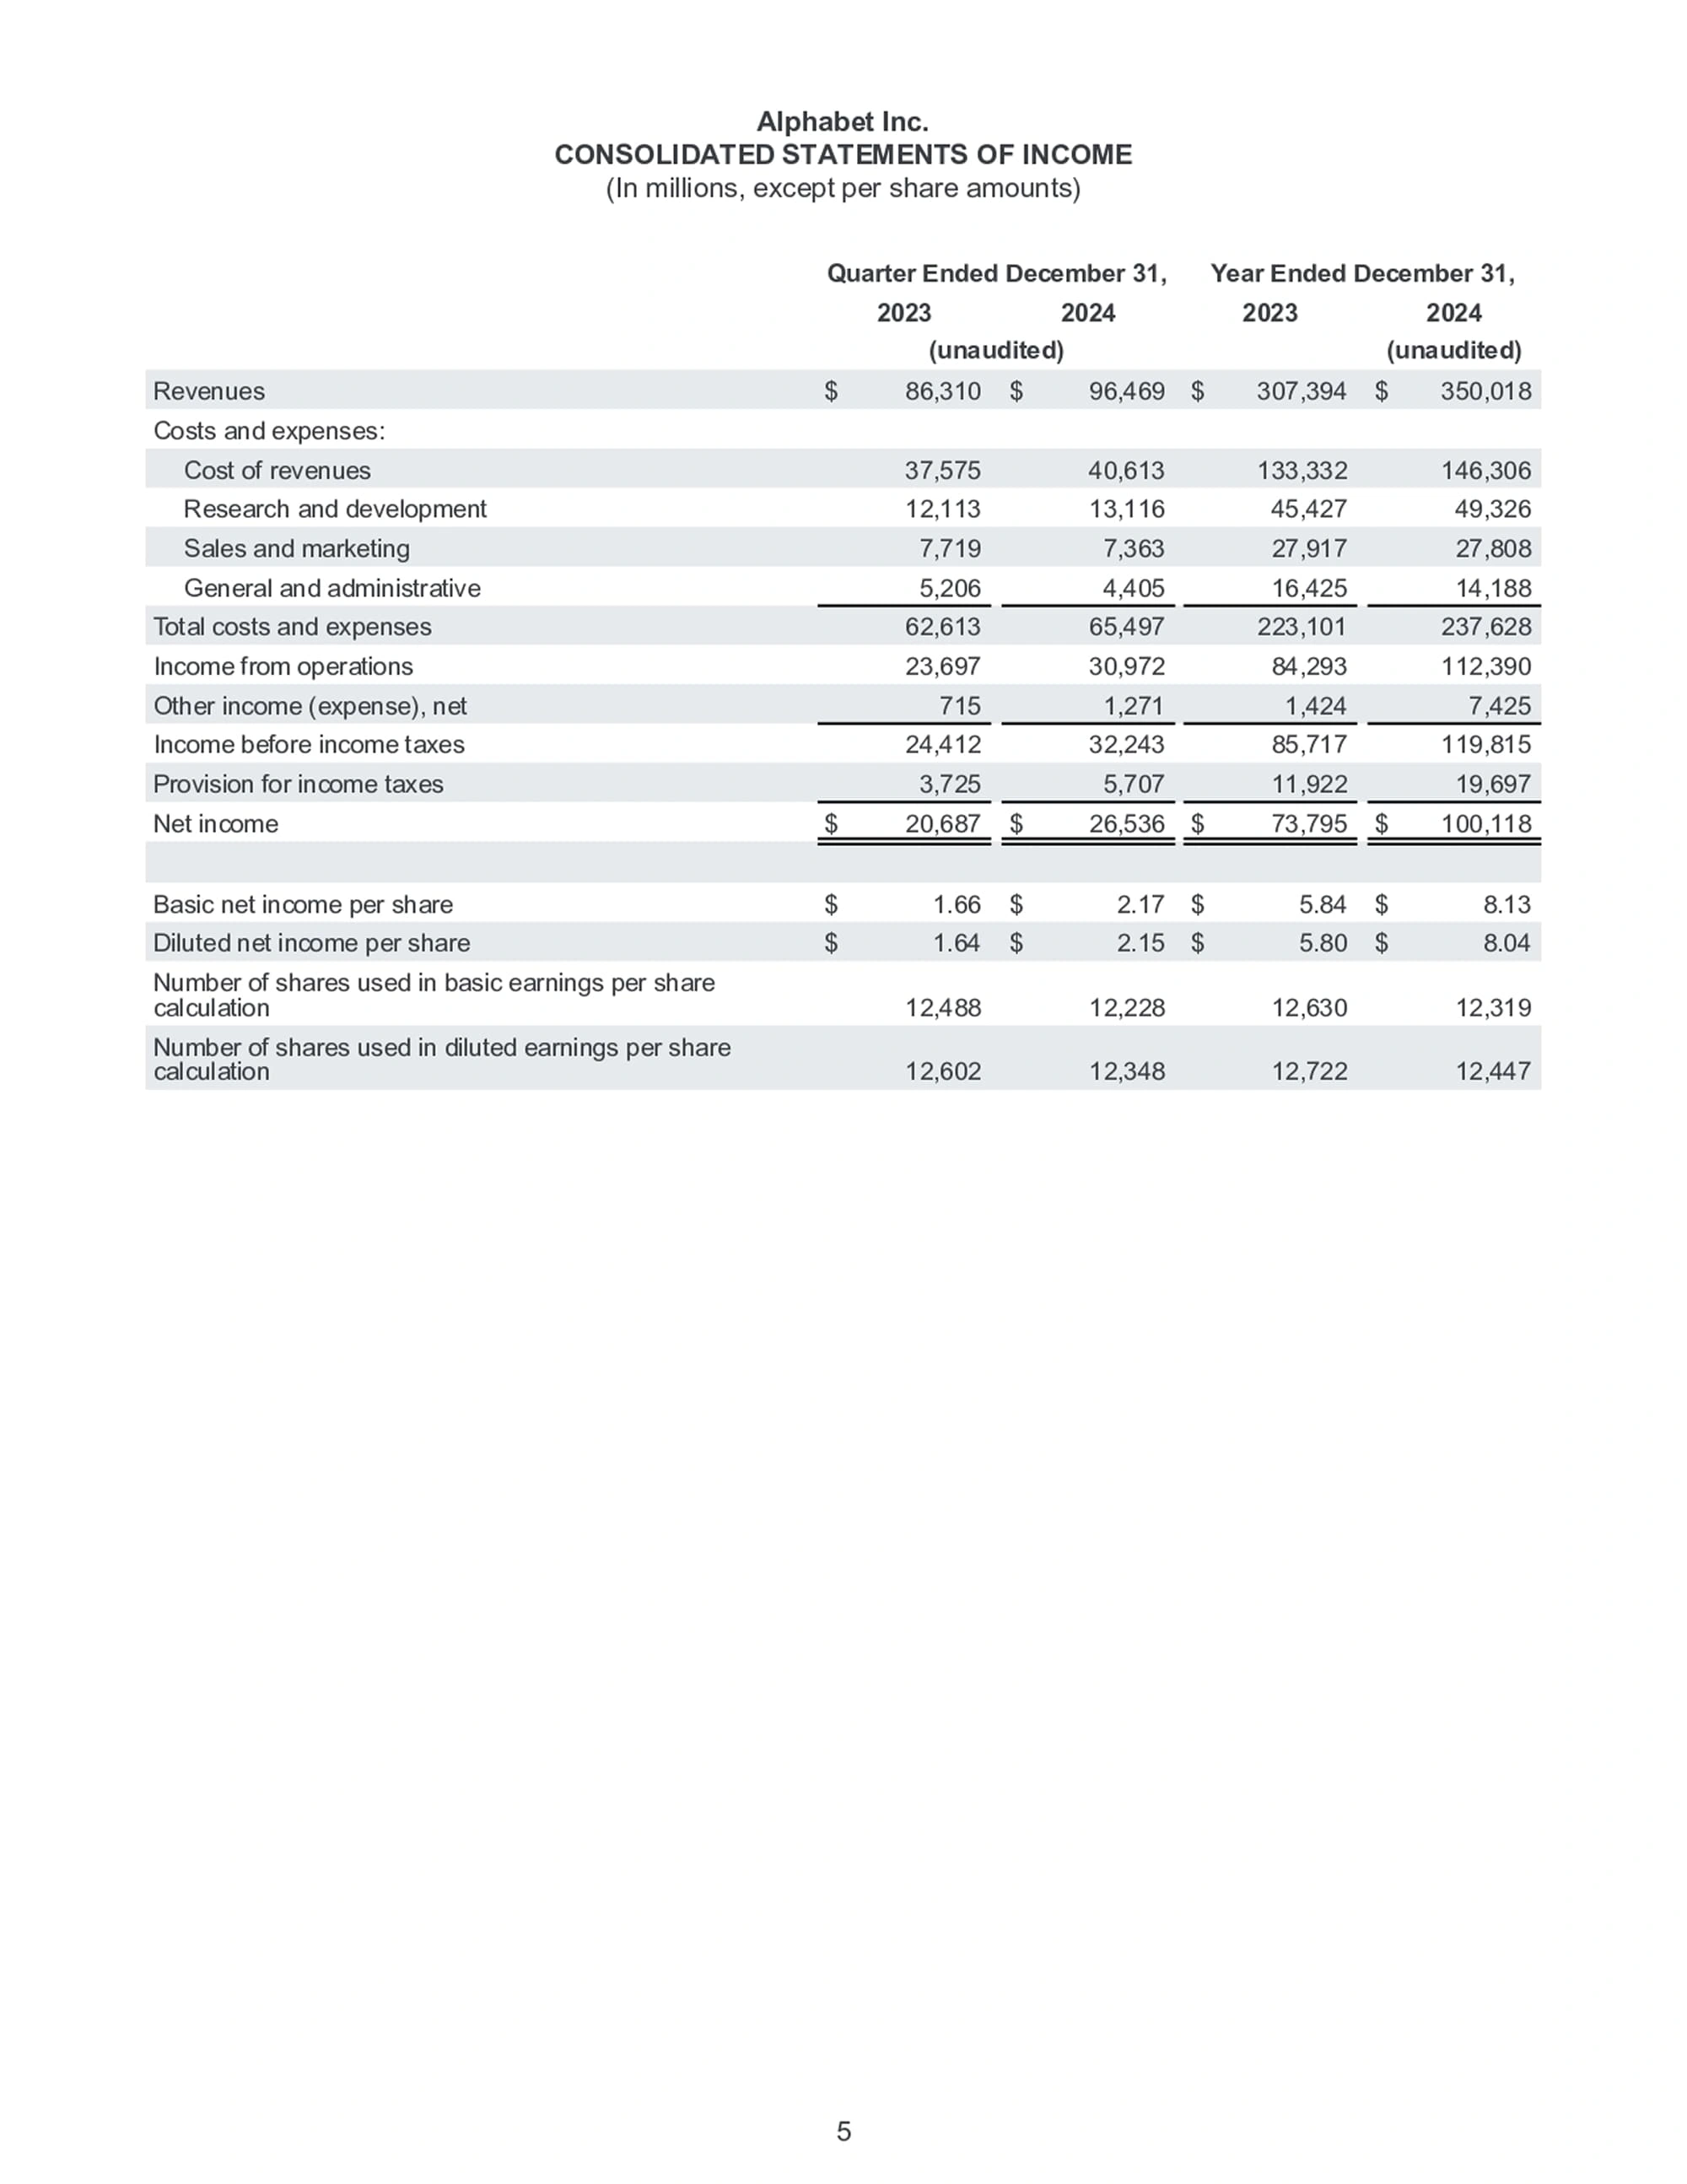
Before we dive in, you might want to take a look at this simplified Alphabet 2024 Q4 financial statement. This will at least give you a basic idea of what one looks like. We'll be using this simplified report for our examples later on.
In the last chapter, the Balance Sheet showed us a company's financial picture at a specific point in time. Now we're talking about the Income Statement, which shows a company's performance over a period of time (a period is usually a quarter or a year). We mainly use the Income Statement to find out one thing: "How much money did it make?"
- Did the company turn a profit? How much?
- How did it make that money? Was it from its core business or from other income?
- Is it keeping its costs in check? Where is the money being spent?
Value investors want to invest in companies that are "profitable now and getting even more profitable." An investment has to be able to grow and create value consistently. The Income Statement is the key report that helps us see a company's profitability.
What is the Income Statement ?
The Income Statement is like a ledger. It shows you how much money a company made and how much it spent over a period of time. It basically boils down to "Revenue," "Costs," and "Profit." Revenue minus costs equals profit.
The items on the Income Statement are just calculated step-by-step using simple subtraction to get to the numbers we care about. Using Alphabet's simplified income statement as an example, you'll see these main items:
- Revenues: This is the money the company earns from its main business—selling products or providing services. It's what people usually call "sales."
- Costs and expenses: The costs required to sell those products or provide those services.
- Income from operations: This is the profit after you subtract the costs from the revenue. It's the main indicator of the company's core profitability.
- Income before income taxes: The total of all profits (from the main business and other outside stuff) before taxes are taken out.
- Net income: After you subtract all the taxes owed, this is the money the company actually gets to keep. It's "the bottom line."
You're going to need financial ratios
Just looking at the raw numbers on an income statement doesn't really tell you the whole story. We need to dig deeper into what those numbers mean. These ratios—which are just percentages or multiples you get from simple math (add, subtract, multiply, divide)—help us break it all down.
The income a company generates from its main business activities.
= Revenues - Cost of Goods Sold
"Cost of Goods Sold" (COGS) basically means all the direct costs related to making and selling a product, like raw materials.
= Gross Profit - Operating Expenses
"Operating Expenses" are the indirect costs of just keeping the business running. This includes administrative costs (like salaries, utilities), selling costs (like ads), and R&D.
= Operating Income + Non-Operating Income
"Non-operating income or loss" is money made or lost from things outside the main business, like investments in other companies, interest income, or currency exchange gains/losses.
= Pre-Tax Income - Taxes
This is what's left after subtracting all the taxes you have to pay.
Look at Profit Margins to See How It's Really Doing
Profit margins show you a company's efficiency—it's like a "money-making efficiency" score.
Of course, the average margin is going to be different from industry to industry. For example, the gross margin for an electronics manufacturer will be worlds apart from an IC design firm. Comparing those two is pointless. That's why you have to compare a company to its peers (in the same industry) and to its own past performance.
Where is the Money Being Spent?
These profit margins don't just show you their money-making efficiency; they also help you analyze their cost structure. You can use them to see if the company's spending is reasonable and figure out which areas need improvement.
For example: If the gross margin is high, but the operating margin drops off a cliff, you know they are spending a ton on rent, salaries, or marketing.
For example: If the operating income is solid, but the pre-tax income is a loss, you know the company is messing around with stuff outside its core business.
Look for Growth Over Time
Is the company's profitability improving, staying flat, or declining? It's tough to tell just by looking at a single report.
But if you pull up the income statements from multiple periods and compare the trends in these financial ratios, you can see the company's growth trajectory much more clearly. For instance, by watching if the gross margin is ticking up year after year, you can get a read on whether their products are becoming more competitive or if they're just getting better at controlling costs.
By the way, most financial and stock investing websites calculate these profit margins for you automatically, so you don't have to do all the hard math yourself.
Let's Walk Through a Real Income Statement
Even though the exact terms each company uses might be slightly different (for example, "Income from operations" and "Gross Profit"), the logic is always the same. Typically, you'll see the income statement laid out from top to bottom, presenting the revenues and costs in order, calculating the profit at each stage, and finally arriving at the net income.
The Structure of Income Statement
When you look at the income statement, you'll notice that the numbers for revenues, costs, and profits are all in the same column. Even though they look like they're all in the same position, the numbers below a bold line are actually the sum of the other numbers above them.
The Details of Income Statement
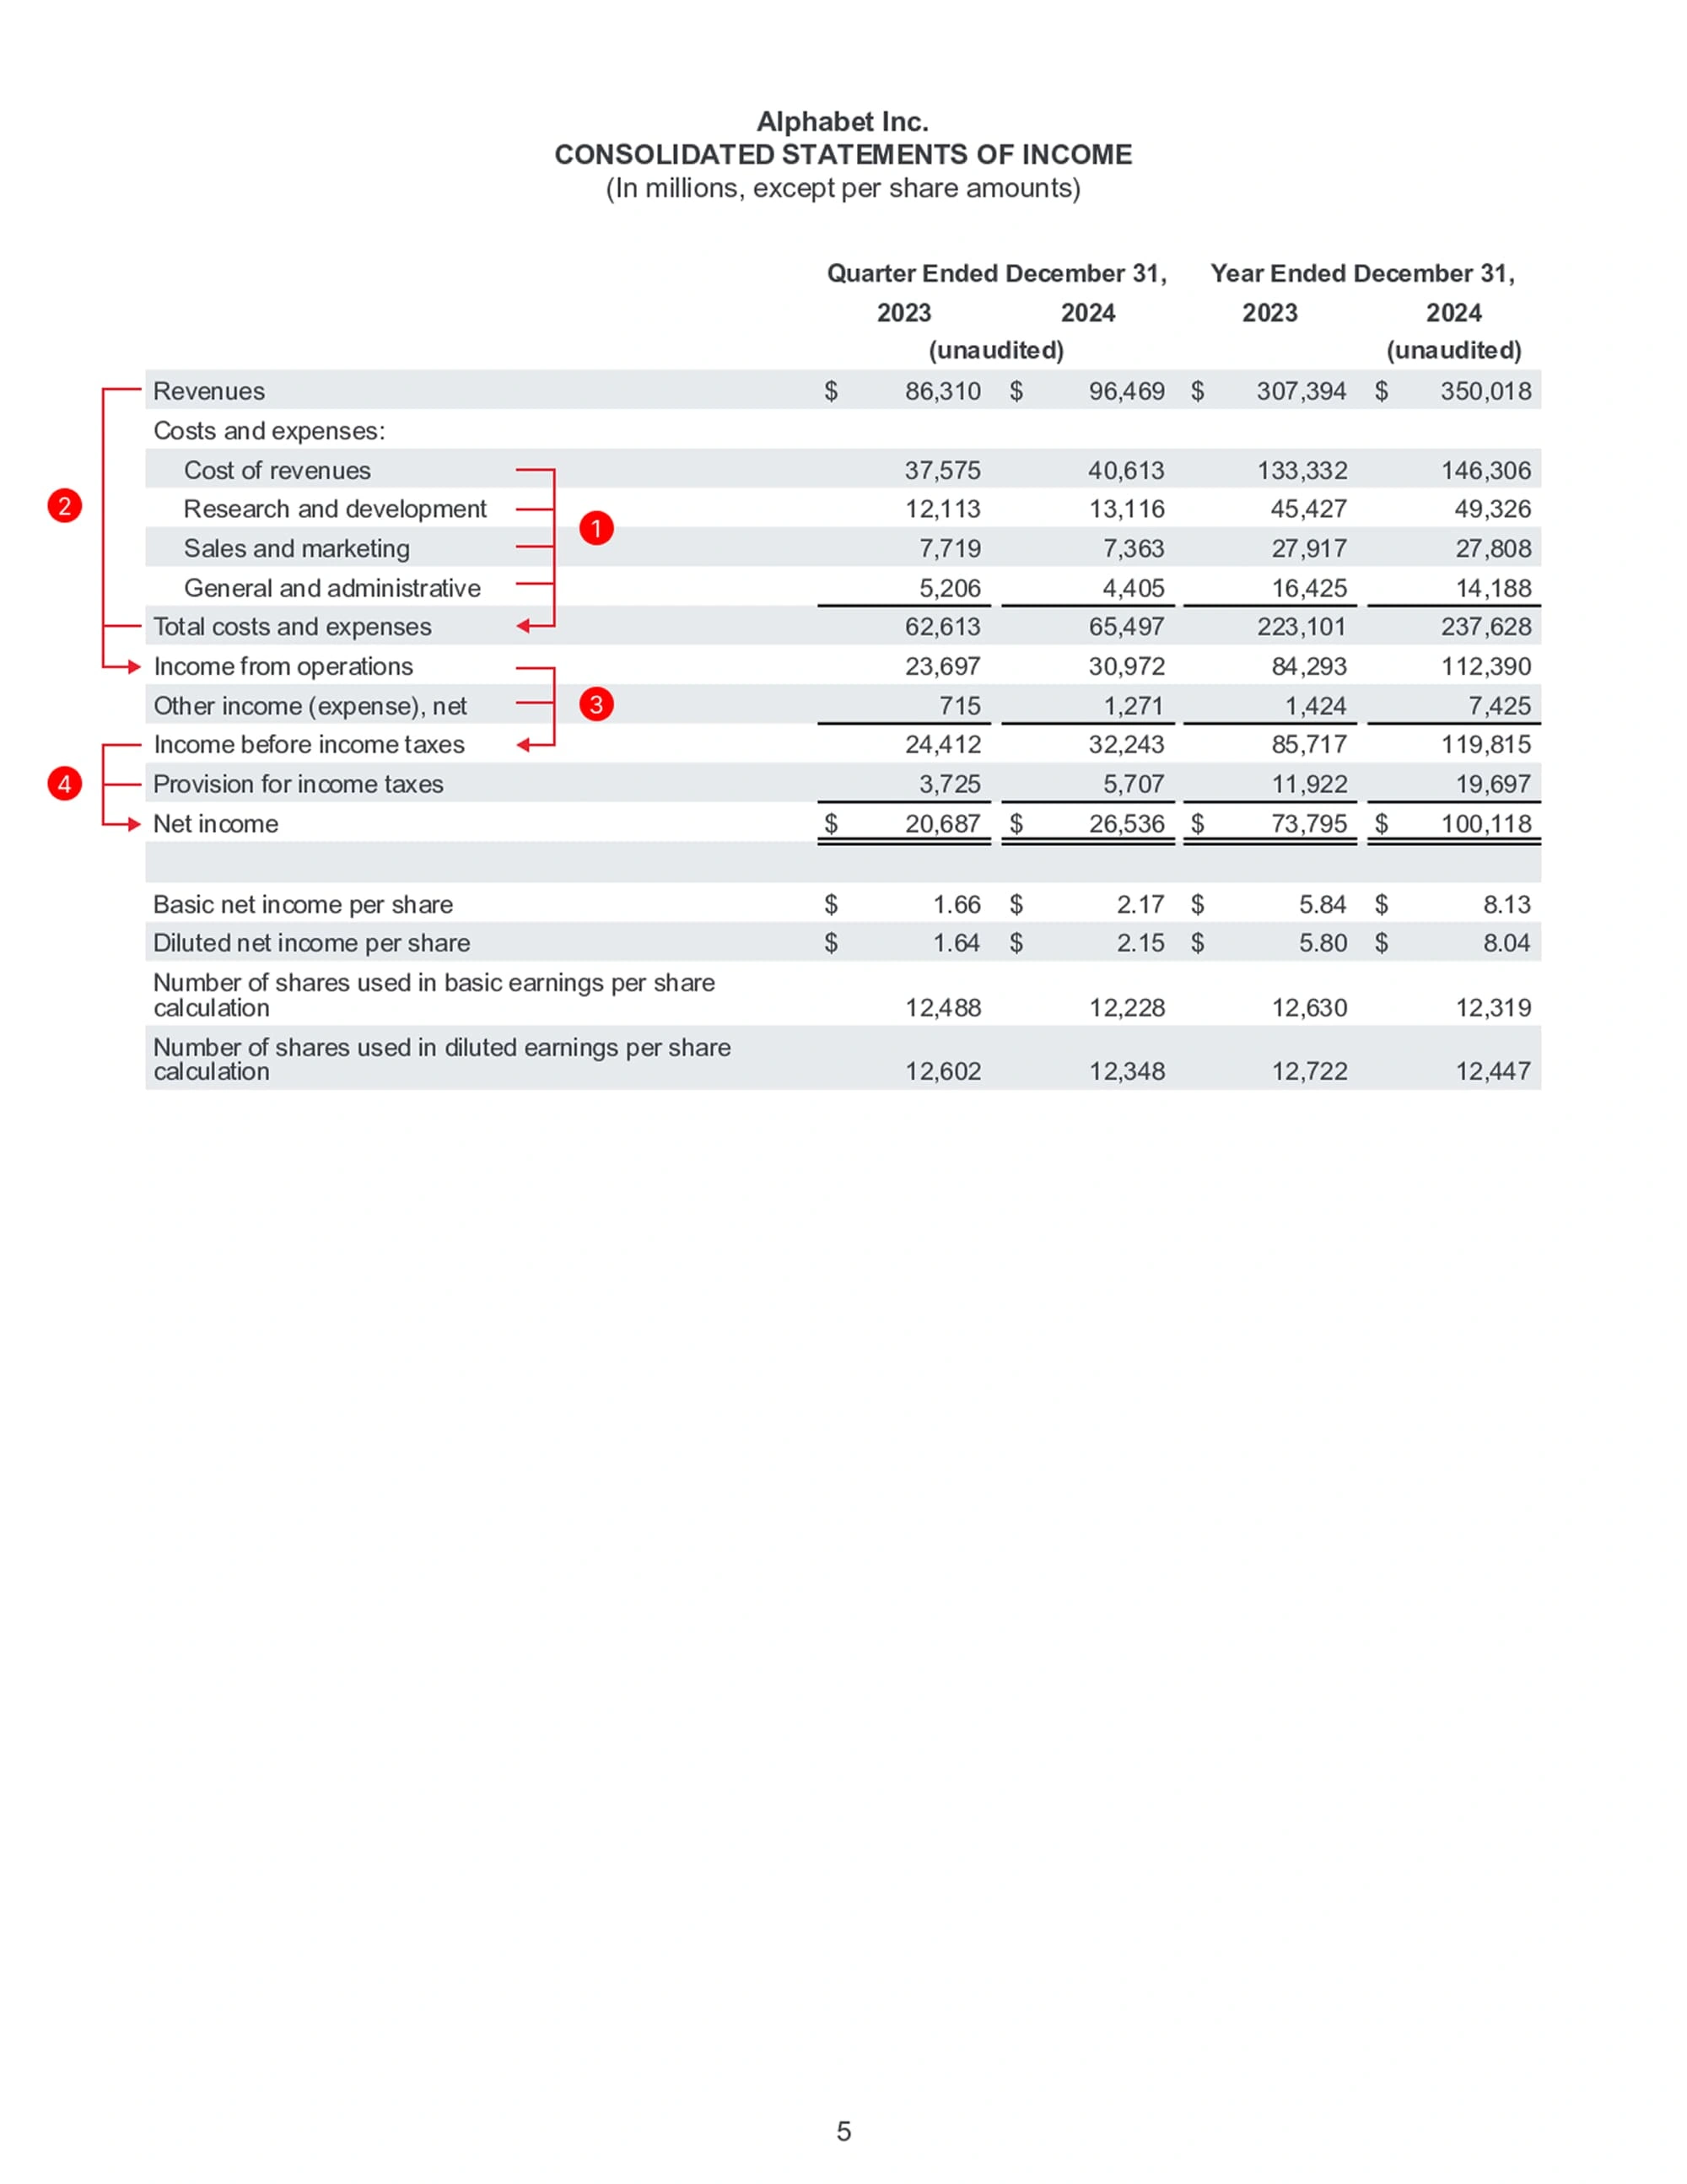
- Costs and expenses includes the following items, which are all added up to get the "Total costs and expenses" number:
- Cost of revenues
- Research and development
- Sales and marketing
- General and administrative
- Income from operations is Revenues minus Total costs and expenses.
- Income before income taxes is Income from operations plus Other income (expense), net.
- Net income is Income before income taxes minus Provision for income taxes.
Terms You'll See on the Income Statement
Let's do a quick review of these key terms to help you understand the report's logic faster. Just remember, not every report will use the exact same terms. Different companies might use different names, and even the same company might change them a few years down the line.
- Revenues: This is the money earned from the company's main business activities.
- Cost of revenues: The direct costs related to creating the product or service. (This is often called Cost of Goods Sold, or COGS.)
- Research and development: Expenses for researching and developing new products, services, or technology. R&D costs represent what the company is spending to widen its "technical moat," especially in the tech industry. But you also have to watch out—too-high costs can increase operational risk.
- Sales and marketing: Costs for advertising, marketing campaigns, salespeople, etc.
- General and administrative: The indirect costs of just running the business, like management salaries, legal fees, and office rent.
- Income from operations: This is the profit you get from subtracting Total costs and expenses from Revenues.
- Other income (expense), net: Income or losses from outside the main business, like interest income or investment gains.
- Provision for income taxes: The amount of income tax estimated to be paid for this period.
- Net income: This is the "after-tax profit" you get by subtracting the Provision for income taxes from the Income before income taxes.
- Basic net income per share: Just like the name says, it's the average profit for every 1 share of stock. The formula is Net income divided by the number of common shares outstanding.
- Diluted net income per share: This is similar to the basic version, but it also factors in the potential "diluting" effect of things like stock options, warrants, and convertible bonds.
- Number of shares used in basic earnings per share calculation: The number of common shares outstanding that was used to calculate the Basic net income per share.
- Number of shares used in diluted earnings per share calculation: The number of common shares outstanding used to calculate the Diluted net income per share, which has been adjusted for all those potential diluting factors.
The Devil is in the Details
If you only look at the "net income" on the income statement, you're going to miss a lot of important information. The real analysis comes from digging into the "quality" and "sustainability" of those profits.
Is revenue consistently growing?
Revenue is the source of all profits. It's the most basic thing you look at to see if a company is growing. What you want to see is "consistent" and "growing" revenue, not revenue that's all over the place or just a one-time spike.
Are costs and expenses going up or down?
This all comes down to the company's cost control and operating efficiency. Ideally, you want to see that cost percentage consistently going down.
- If your cost keeps creeping up as a percentage, it might mean they can't pass on rising material costs to customers, or their production is getting less efficient.
- If operating expenses (as a percentage of revenue) keep rising, it could mean their spending on management, sales, or R&D isn't paying off. Or, they could just be wasting money on stuff that doesn't matter.
Are the margins (gross, operating, and net) stable or improving?
Looking at the long-term trend of these margins is way more meaningful than just looking at a single number. Great companies can usually maintain their margins, or even better, improve them over time.
Gross Margin
This shows how much profit is left after subtracting the direct costs of what they sell. For value investors, this represents the company's pricing power and competitiveness. A related metric, operating margin, shows the company's core business efficiency.
In the simplified Alphabet report, it lumps costs and operating expenses together. A more detailed report would split them out to see gross margin and operating margin separately. But just to make this easy, we'll just refer to it as gross margin for now.
In the sample report, "operating expenses" refers to Research and development, Sales and marketing, and General and administrative.
Pre-Tax Margin
This is the total profit you get after adding in any non-operating income (to your operating income). It tests the core business and how they do with outside investments. Value investors want to see companies focus on their main business, so the lower this "other" portion is, the better.
Is their cost control effective?
You usually start digging into this when you see margins shrinking. Is it because revenue is down? Or is there a problem with cost control? If it's a cost problem, you have to dig into the line items for operating costs and expenses to see exactly where the money is going.
Are there any red flags in "Other Income"?
This brings us back to non-operating income. Value investors get really focused on this. You want companies to stay focused on their core business, growing and widening their moat in what they do best. Relying too much on "other income" is not a good sign, especially if that income is volatile and unpredictable.
How You Should Be Reading an Income Statement
When you first get an income statement, it's easy to get dizzy looking at all the dense numbers. Don't worry. As long as you follow the logic we just talked about, you'll get the hang of the report's structure pretty quickly.
Here are a few more tips to give you a better sense of direction.
1. Compare it to historical data to see the trend.
For a value investor, the most important thing to look at in that final profit number is the trend over time. Over the last few months, quarters, or years, is the profit trending up, down, or just bouncing all over the place? This helps you judge if the company's current operations are actually improving.
2. Compare it to other companies in the same industry to see where it stands.
Besides comparing a company to its own past, you have to compare it to its competitors. Find out who its rivals are and go look at their income statements. Look at the "profit margin numbers" and "profit trends" side-by-side. This helps you analyze who is improving and who is being run more efficiently.
For example, Company A has 10% annual growth and a 30% gross margin. Is that high or low? You have no idea until you look at its competitors.
3. Don't just look at the final net profit; look at what makes it up.
Sometimes, very subtle changes are hidden in the numbers in the middle. You'll never see them if you just skip to the bottom line—and these changes could affect the company's future.
For example, maybe the pre-tax profit margin is holding steady at its average. But if you look closer, you see the gross margin is actually dropping. The only reason the pre-tax margin looks okay is that they also cut operating expenses (like employee bonuses or marketing) to match. What does that tell you? It means their product's competitiveness is quietly slipping. That's a change worth digging into.
4. You have to read the income statement with the balance sheet and cash flow statement to get the full picture.
The income statement is critical—it's like the engine of the business. But it's not the only report that matters. To fully understand a company's financial health, you have to analyze it alongside the balance sheet (to check its financial structure) and the cash flow statement (to see if it's actually bringing in cash).
The cash flow statement is especially important. It's a report Warren Buffett pays a lot of attention to.
Sometimes, a company's income statement looks amazing on paper, but it was faked by "stuffing the channel" (pumping up inventory) or using other accounting tricks. It didn't actually bring in any real cash. Generating cash is what proves you've truly put money in your pocket. That's why you must read all the financial statements together.
The Income Statement is Used to Judge Profitability and Growth
By now, you should have a basic idea of the Income Statement. It's our main tool for sizing up a company's "profitability." A company that consistently generates profits and keeps its costs in check is the one most likely to deliver long-term returns for its shareholders.
Warren Buffett loves to invest in businesses that have a durable competitive advantage. He said, "I like predictable businesses. If you have a business that has a history of earning money year after year, and it barely needs any extra capital, that's a great business".
The income statement is the key that helps us find exactly those kinds of companies. It guides us to focus on businesses whose profitability is stable and that can keep making money without needing a ton of reinvestment.
Next up, you have to learn how to read the "Cash Flow Statement" to understand the company's actual flow of cash—and find out if it's really making money!